User Interface
This section will guide you through the DepBuilder’s user interface. The process of defining a new build pipeline is:
- Create a new DepBuilder job, see Create the Project section.
- Define the build pipeline via the DepBuilder DSL, see Build Definition section.
- Watch the build progress via the project dashboard, see Build Visualization section.
Create the Project
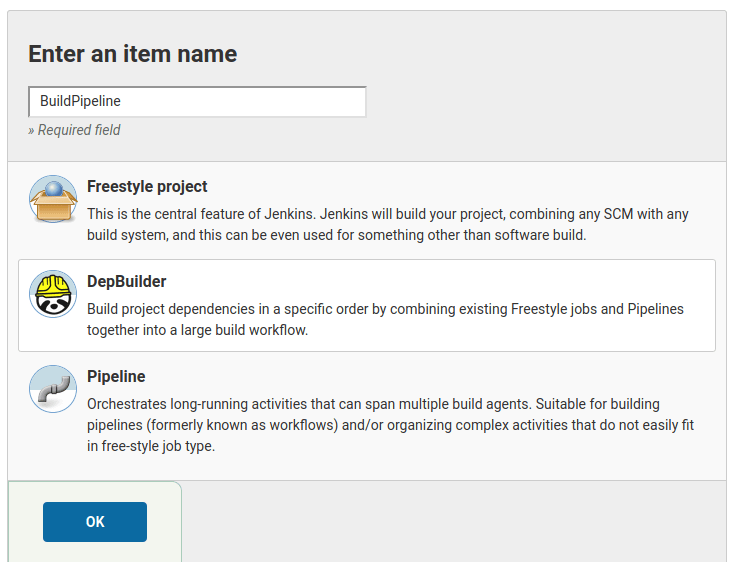
- On the Jenkins dashboard click on the New Item option in the left sidebar
- Enter the build pipeline name.
- Select the DepBuilder from the installed Jenkins plugins listed below.
- Click OK, to create a new build pipeline using the DepBuilder DSL.
Build Definition
The DepBuilder supports two ways of defining the build pipeline:
- Script: write the DSL through the Jenkins user interface.
- SCM: fetch the DSL script via your favorite source control tool (Git, SVN, etc…).
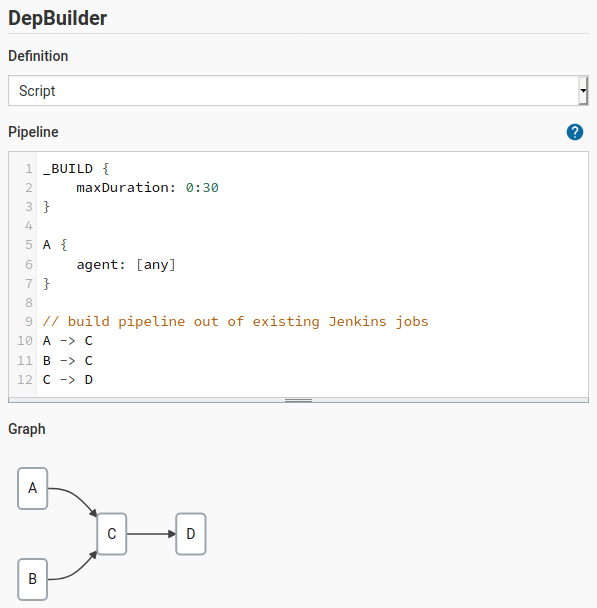
Script
Script configuration option is the easiest one to get started: select the script option from the definition combobox and start defining the build pipeline in the text area below. The build script will be verified every time the input area loses focus (click outside of the text area). For more info about the DepBuilder DSL, see Features page.
In case of any error made in the script, a helpful error message will show up underneath the text area. The build visualization graph under the text area will automatically update the build nodes according to the defined pipeline. Clicking on the job nodes in the build visualization graph will redirect you directly to the clicked job’s dashboard.
Note
Once you are comfortable with the DepBuilder DSL, we suggest you to put your pipeline script into the SCM repository. For more info, see the SCM option below.
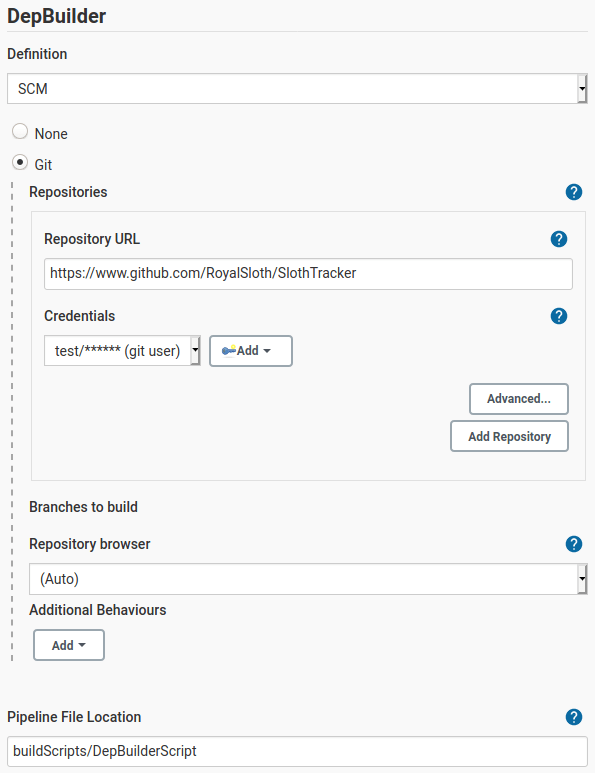
SCM
You can also set up the build pipeline via the source control management option (SCM). The SCM functionality is provided via the existing Jenkins plugins that you have to install manually and are not part of the DepBuilder, such as Jenkins GIT and Jenkins SVN.
- Select the SCM option from the definition dropdown.
- Select the SCM (Git, SVN, etc…), enter the project repository url and valid SCM credentials.
- Add a relative path to the build script in the repository in the Pipeline File Location field. The name of the build script is not strictly defined and you can name it however you want.
After starting the build, the build will:
- Download the chosen repository.
- Verify the script from the Pipeline File Location and terminate the build in case of any error.
- If the script is valid, it will start to build the jobs defined in the script.
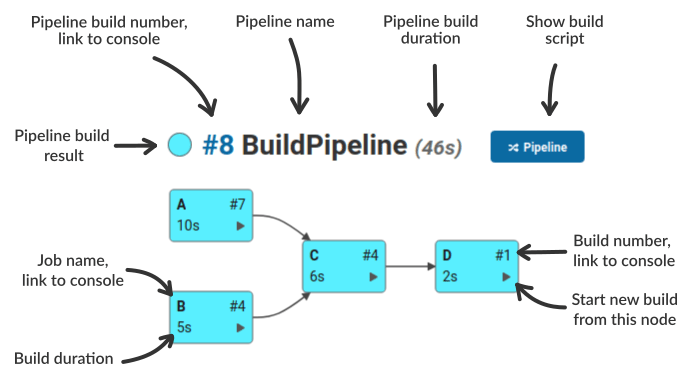
Build Visualization
While the pipeline build is in progress, you can observe the current build status of jobs on the project’s dashboard page. The following sections will describe the possible states that your build graph might show.
Note
In case the pipeline is too wide and does not fit to the screen you can pan the graph with mouse (hold left mouse button and drag).
You can also zoom in/out the pipeline with mouse wheel and holding shift.
Build in Progress
When the build is in progress, the pipeline status light and the nodes that are currently being built are slowly fading in and out in light blue color.
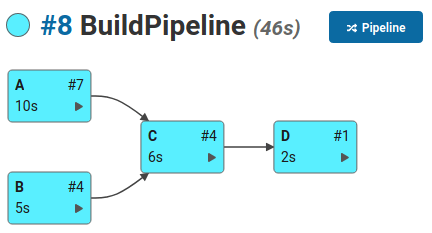
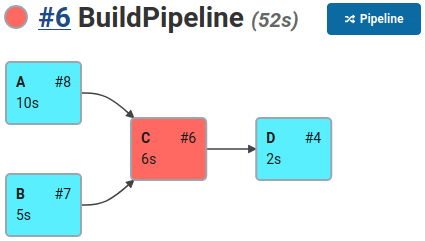
Build Success
On a successful build, the pipeline status light and the jobs that were built successfully will be shown in blue.
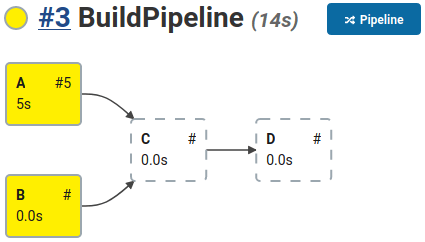
Build Aborted
When the user manually aborts the build, the aborted jobs are shown in yellow. It’s possible that the user aborted the build while there was no other job that was being built; in such case the pipeline status light will be shown in yellow, but no other node in the graph will be marked as aborted.
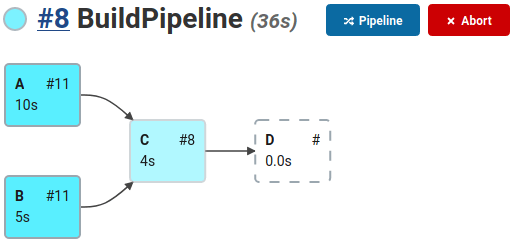
Build Failed
When the build has failed, the pipeline status light and the job that failed will be shown in red.
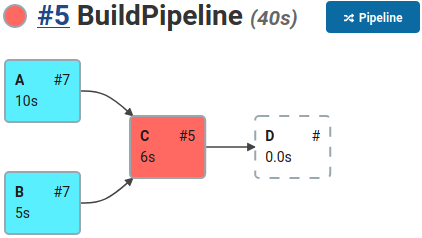
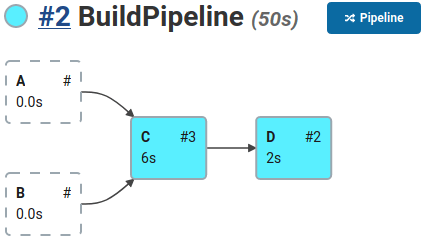
If the onParentFailure option in the job settings sectoin was set to BUILD, the build graph will
show the failed jobs in red, but the rest of the build will continue building. In the example
below the onParentFailure option of the job D was set to BUILD.
Missing Build History
The build history of the job could be missing either due to manual deletion or due to the
Jenkins Discard old builds build option that is set on the job’s configuration page.
If the build information is missing, the graph will display such a build
job in white without the build number and duration.